One question, on a board you can touch.
Every introduction to machine learning says that a model is judged on data it has never seen. The sentence is easy to read and hard to feel. OverFit was built so that you feel it: the training data is on the board, the test data is hidden until you press a button, and the two scores that appear are your own doing. It sits on this site next to PolyFit, which is a game for everyone; OverFit is for people who already know some machine learning and want to see what overfitting and underfitting look like.
The rules are the real ones. A cut is a split on one feature, a region predicts by majority vote, impurity is Gini, the computer grows trees best cut first as scikit-learn does with max_leaf_nodes, and pruning is cost-complexity pruning. Nothing is simplified in a way an expert would object to, and the page says what the board cannot show.
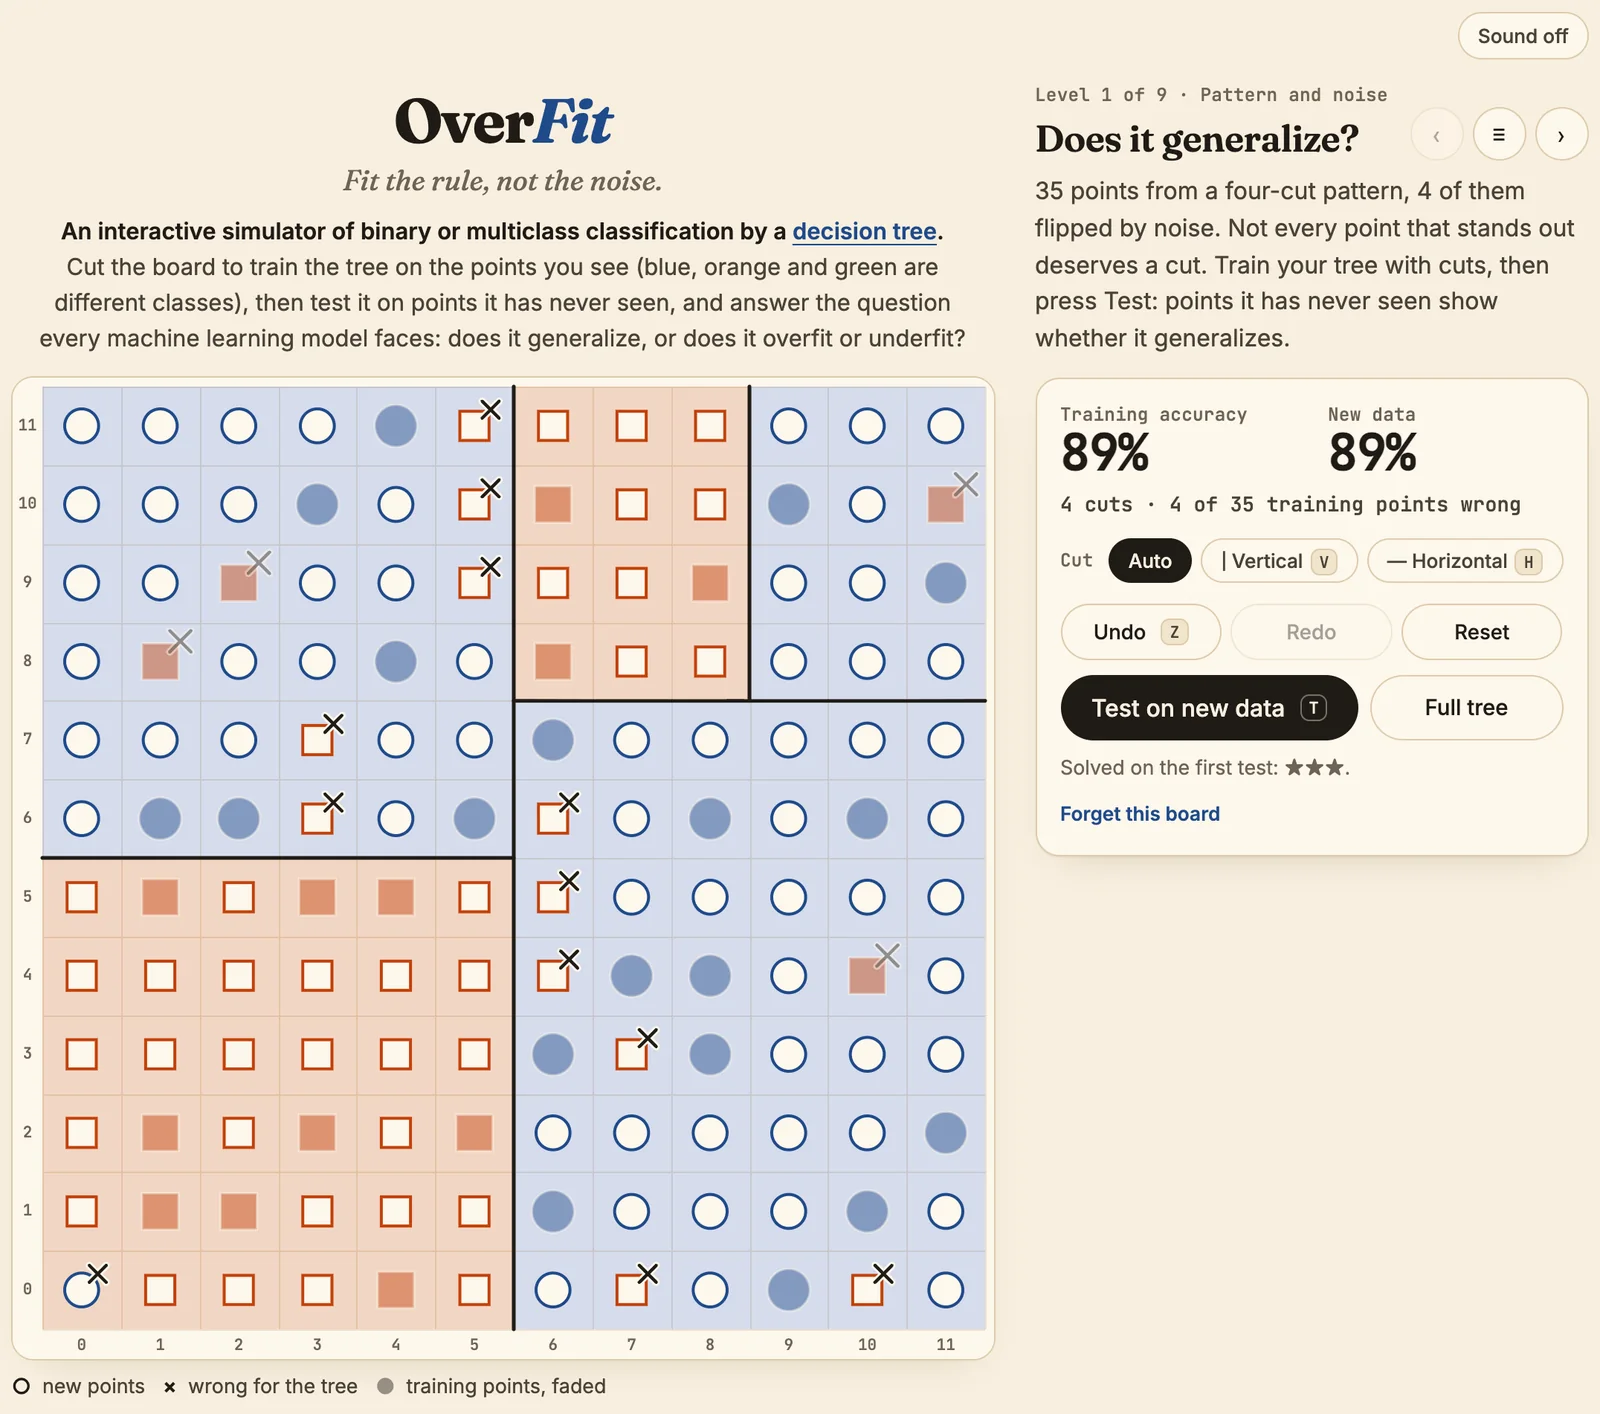
The board is the model.
- Points. A 12 × 12 grid, at most one point per cell: blue circles, orange squares, and green triangles on the two boards with three classes. The shape is there for readers who do not tell the colors apart. The points are the training data, and you are told how many of them were flipped by noise, never which ones.
- A cut is a split. A straight line of the grid, inside one region, with at least one point on each side: the question
x ≤ 4.5ory ≤ 6.5, with the threshold halfway between two values, exactly as a CART tree writes it. The board starts as one region, the root; every cut turns one region into two, and the regions are the leaves. Removing a cut removes everything below it, as pruning a node removes its subtree. - A region votes. Every region predicts the class of most of its training points; on a tie, or with no points, it keeps the class of the region it was cut from, a rule of the simulator that the page states. A training point of another class inside a region is a mistake and carries a small ×.
- Two scores. Training accuracy is the share of the visible points the tree gets right. New data is the same share on points it has never seen, and it reads “?” until you press Test; change the tree, and it goes back to “?”.
/** The most frequent class; on a tie (or with no points) `fallback` wins if it is among the best. */export function majority(counts, fallback = 0) { const best = Math.max(...counts); if (best === 0 || counts[fallback] === best) return fallback; return counts.indexOf(best);}/** Gini impurity of a region: the chance that two points drawn at random from it, with replacement, have different classes. */export function gini(counts) { const n = counts.reduce((a, b) => a + b, 0); if (n === 0) return 0; return 1 - counts.reduce((s, c) => s + (c / n) ** 2, 0);}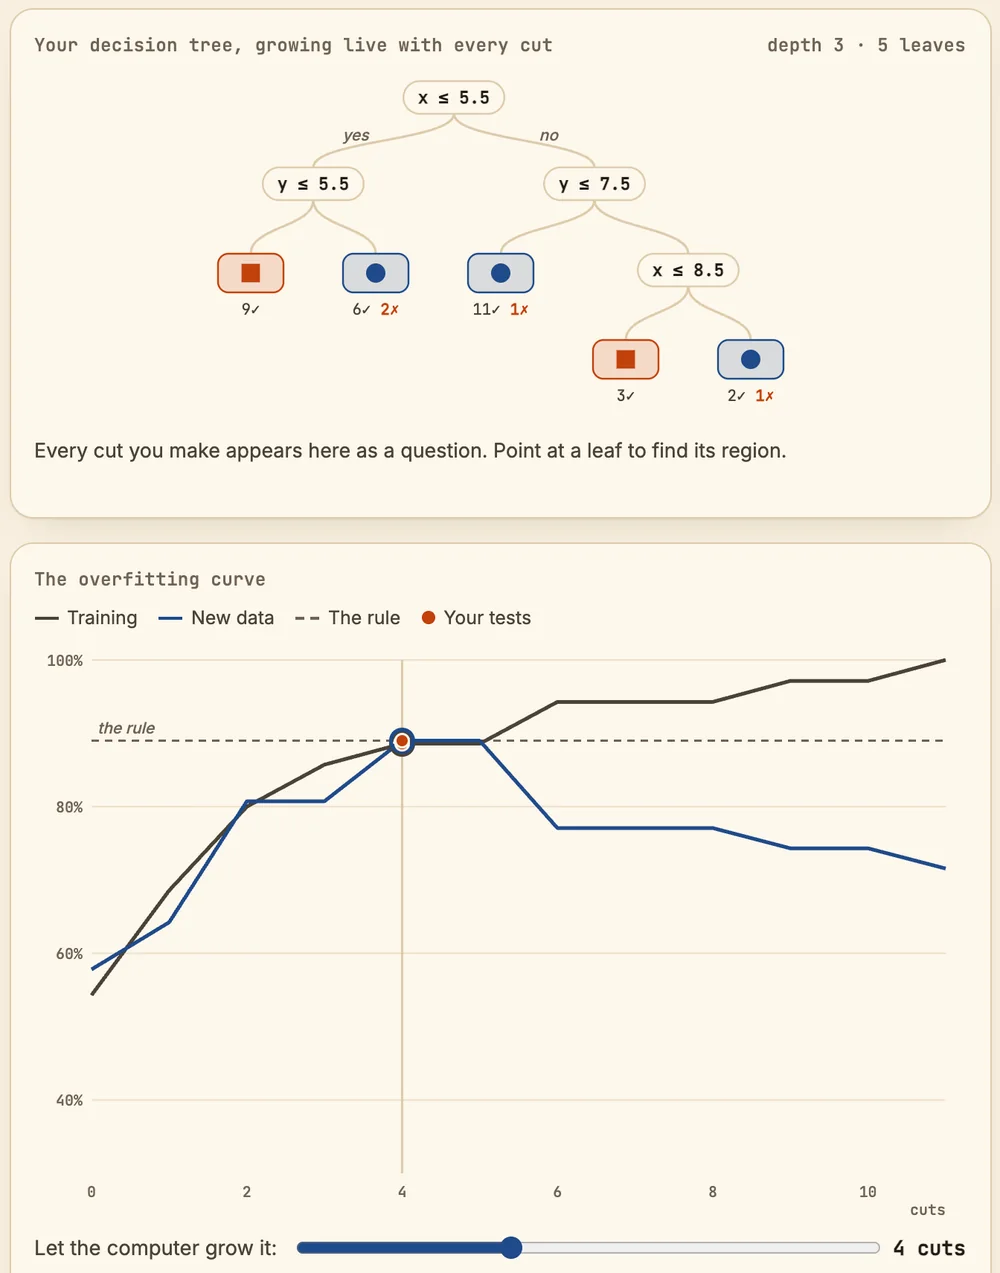
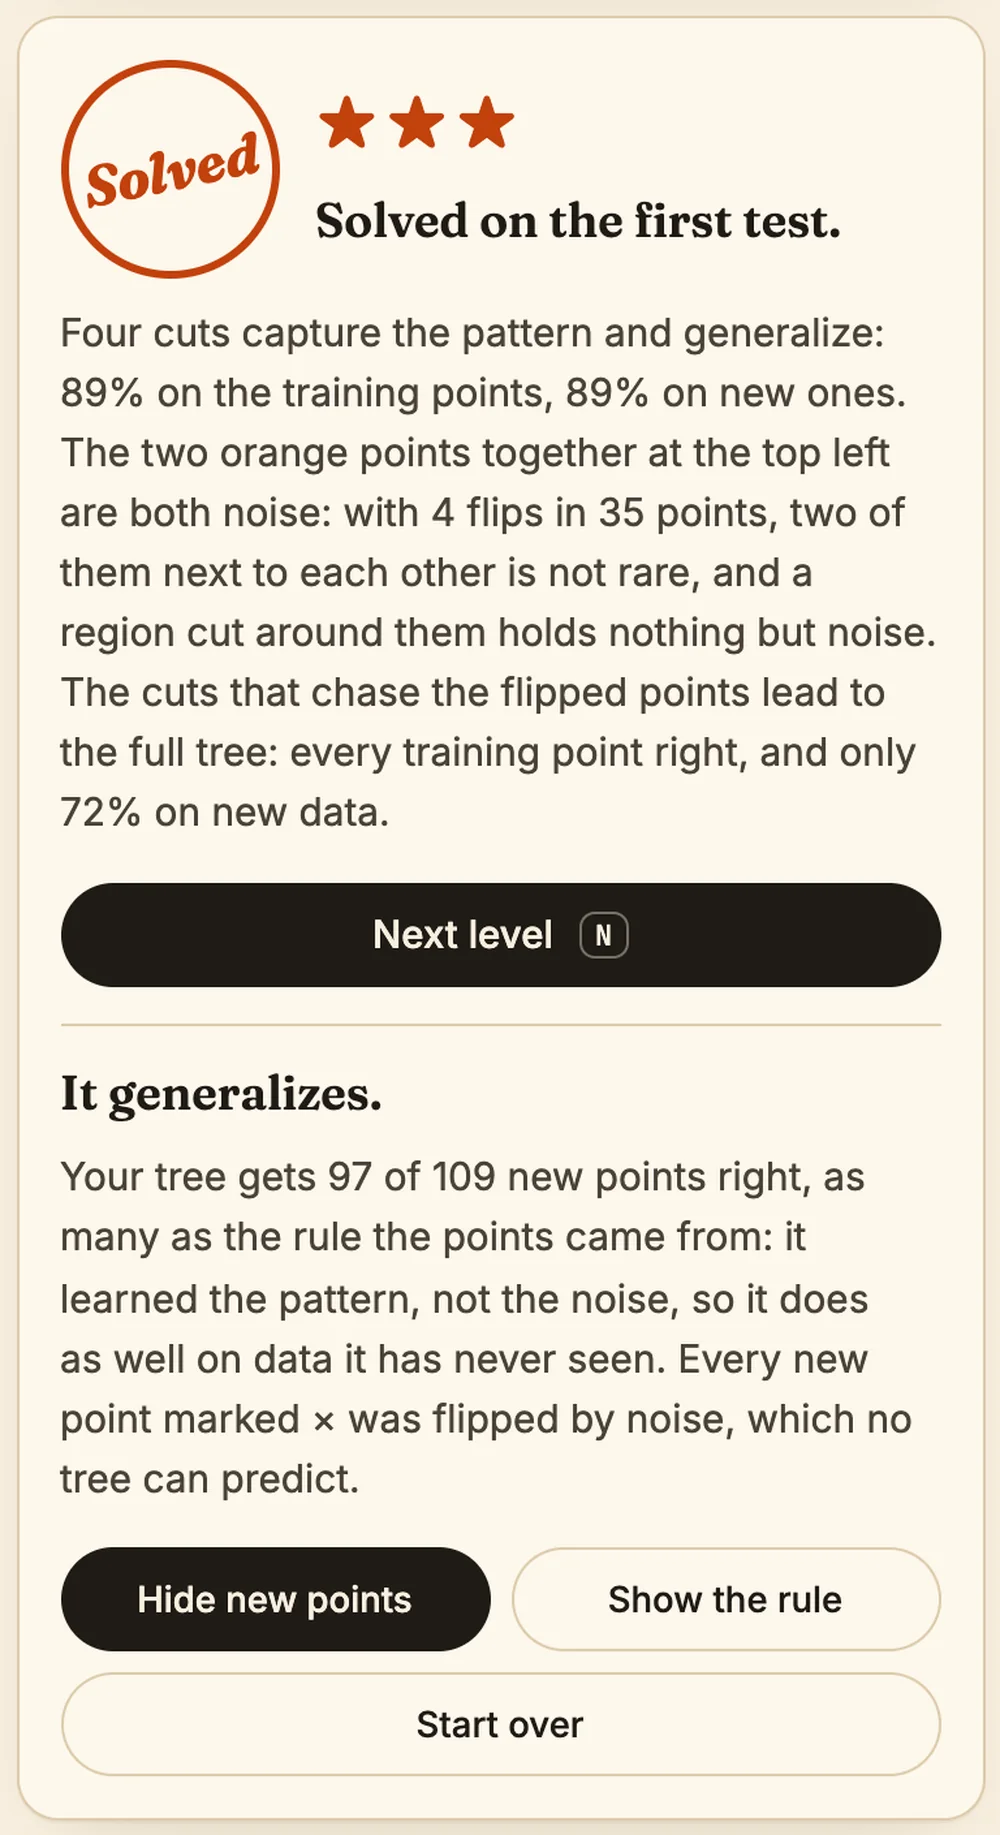
A test set you can trust.
Every board comes from a rule, a decision tree written as data, and some of its points were flipped: drawn in a class that is not the one of their cell. When you test, the tree is scored on one new point in every empty cell, classed by the rule, with the same share of them flipped as on the board. Which ones are flipped is drawn with a seeded generator, so the new data of a board is always the same: the same tree always gets the same score, on every device, and every number on this page can be reproduced.
/** The new points of a board: [{ x, y, c, noise }], one per empty cell. */export function newData(rule, points, { noise = 0, classes = 2, seed = 1 } = {}) { const taken = new Set(points.map((p) => p.x * N + p.y)); const out = []; for (let y = N - 1; y >= 0; y--) { for (let x = 0; x < N; x++) { if (!taken.has(x * N + y)) out.push({ x, y, c: classify(rule, x, y), noise: false }); } } const random = createRandom(seed); const flips = Math.round(noise * out.length); for (const p of shuffle(out.slice(), random).slice(0, flips)) { const other = Math.floor(random() * (classes - 1)); p.c = other >= p.c ? other + 1 : other; p.noise = true; } return out;}Since the rule gets every clean point right and every flipped point wrong, its accuracy on new data is exactly the share of clean points, and on average no classifier can do better: it is the Bayes rate of the board. A tree can beat it on the fixed sample only by luck, by being right on a flipped point, and the verdict says so. Flipped points sit at least two cells from every edge of their region and never in a corner, so that no single cut, and no pair of cuts in a corner, can isolate one by accident.
| Level | Training points | Flipped | New points | Flipped | The rule on new data |
|---|---|---|---|---|---|
| 1 Pattern and noise | 35 | 4 | 109 | 12 | 89% |
| 2 Three together | 31 | 1 | 113 | 4 | 96% |
| 3 Too simple | 38 | 3 | 106 | 8 | 92% |
| 4 Few points | 13 | 1 | 131 | 10 | 92% |
| 5 Heavy noise | 36 | 7 | 108 | 21 | 81% |
| 6 Three classes | 34 | 3 | 110 | 10 | 91% |
| 7 Beat the library | 38 | 3 | 106 | 8 | 92% |
| 8 Prune it | 37 | 4 | 107 | 12 | 89% |
| 9 Two kinds of noise | 38 | 4 | 106 | 11 | 90% |
Over the nine levels, 300 training points, 30 of them flipped, and 996 new points. The rule's score on new data is the best any classifier can expect on that board.
Where the library's tree stops helping.
After the first test, a chart under the tree shows the overfitting curve of the board: training accuracy and accuracy on new data for the trees a library grows as its cap on leaves is raised, from no cut to a tree whose every leaf is pure. The growth is best-first, as scikit-learn grows a tree with max_leaf_nodes: at each step, among all the leaves, the cut with the largest drop in Gini impurity, weighted by the number of points it splits. Each gap between neighboring values is tried once, at its middle line, where a library places its thresholds.
/** The trees from 0 cuts to a pure tree, as snapshots: [null, [..], ...]. */export function growthPath(points, classes) { const tree = new Tree(points, classes); const path = [tree.snapshot()]; for (;;) { let best = null; for (const leaf of tree.leaves()) { if (Math.max(...leaf.counts) === leaf.total) continue; // pure // one line per gap between points, in the middle of the gap, as a library places it for (const { axis, t } of gapCuts(tree.counter, leaf.box)) { const p = tree.preview(leaf, axis, t); // impurity removed, counted in points: n × (Gini before − weighted Gini after) const drop = leaf.total * (p.giniBefore - p.giniAfter); if (!best || drop > best.drop + 1e-12) best = { leaf, axis, t, drop }; } } if (!best) return path; tree.split(best.leaf, best.axis, best.t); path.push(tree.snapshot()); }}Training accuracy never falls along the curve. On every board but one, accuracy on new data rises to its best at the rule's own number of cuts, where it equals the rule's score, and never rises again: the boards are chosen so that this holds, and the page says so. It also says what the chart does not show: on real data the curve is noisier, it can wobble and rise again after a dip, and nobody tells you how many cuts the rule has.
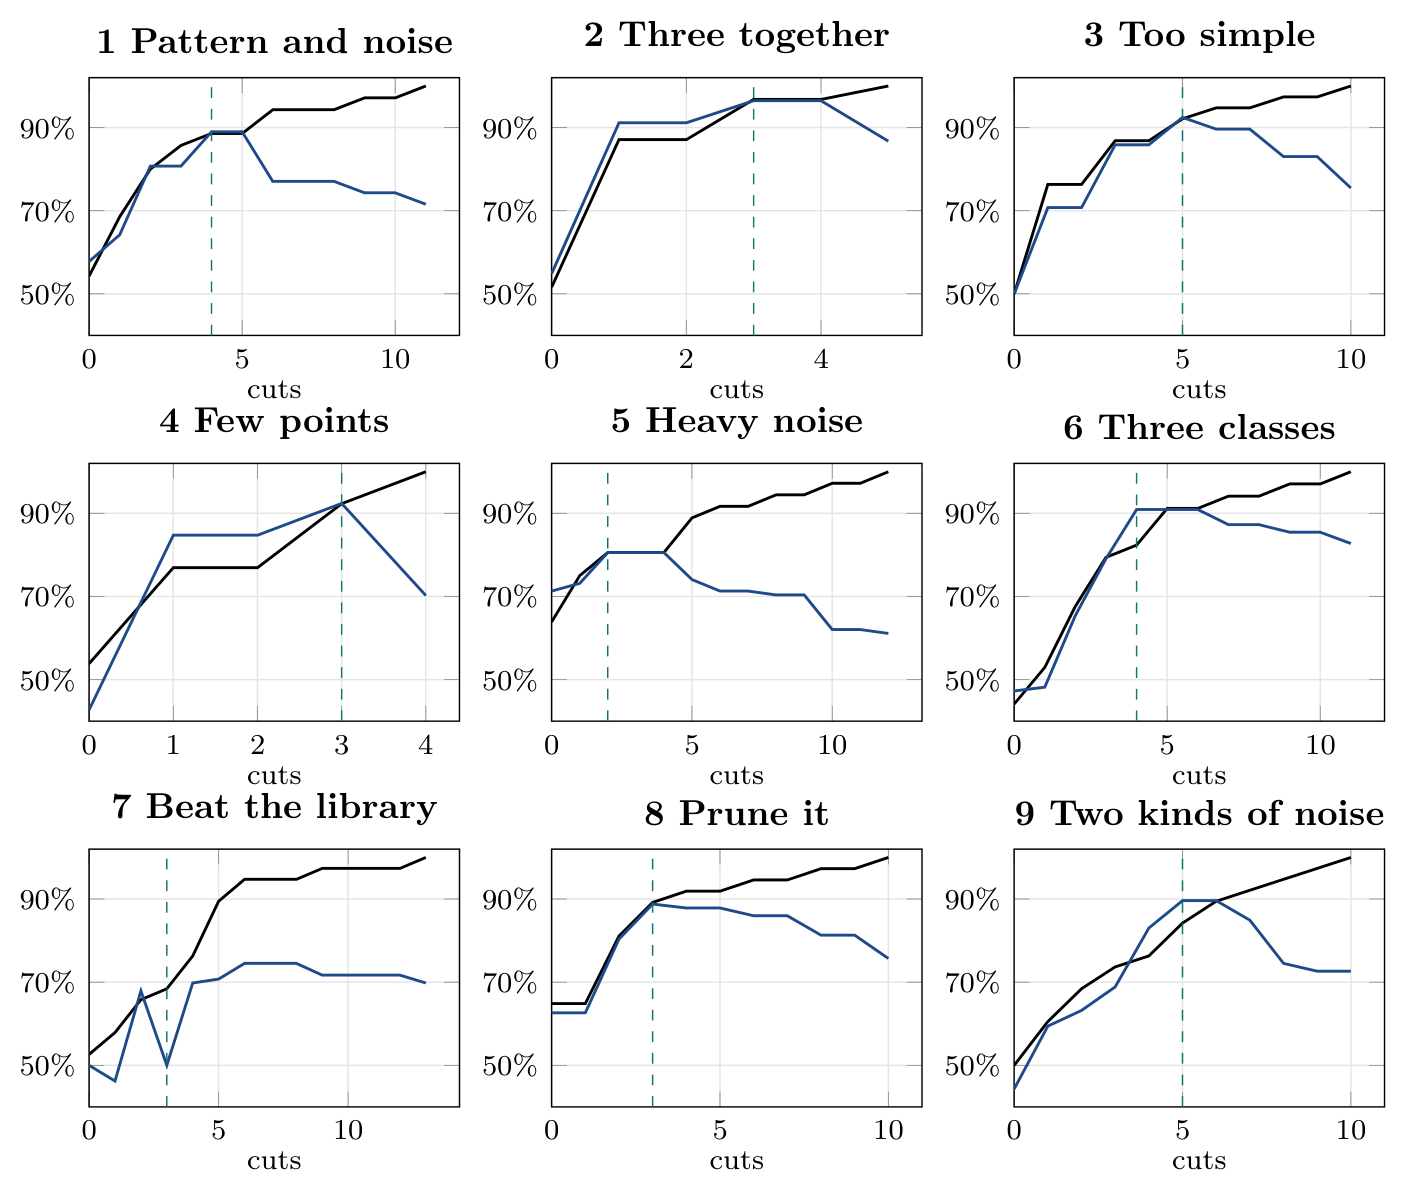
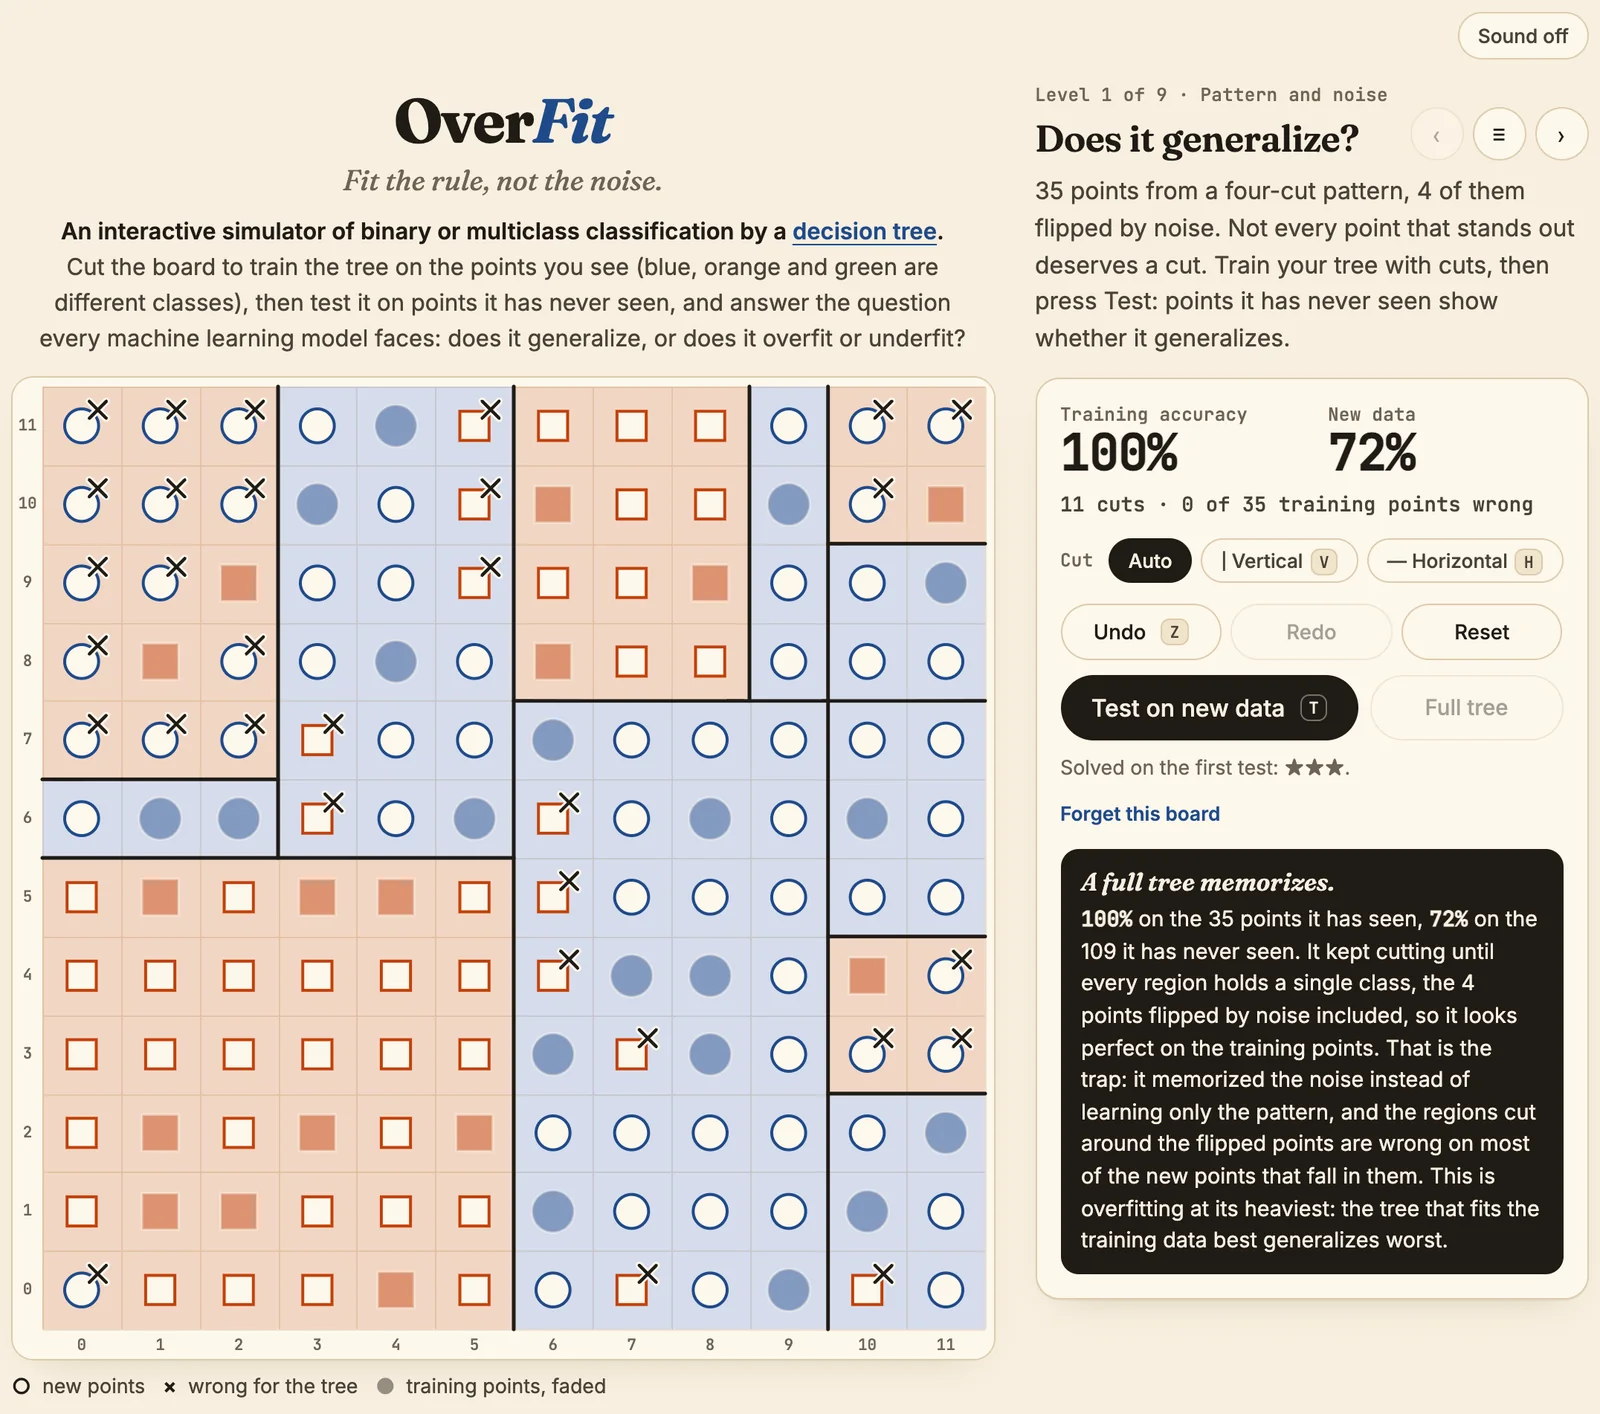
The button Full tree grows the tree to the end of the curve: every leaf pure, 100% on the training points, and a callout explains why that is the trap. The full tree looks perfect on the data it has seen because it memorized the noise along with the pattern, and the small regions cut around flipped points are wrong on most new points that fall in them: on level 1 it has 11 cuts and scores 72% on new data, against 89% for the four cuts of the rule. The tree that fits the training data best generalizes worst.
The same question, from nine sides.
| Level | Cuts of the rule | The rule on new data | Full tree: cuts | Full tree on new data | What it shows |
|---|---|---|---|---|---|
| 1 Pattern and noise | 4 | 89% | 11 | 72% | two flipped points side by side are a trap, not a region |
| 2 Three together | 3 | 96% | 5 | 87% | three odd points together are part of the pattern, not noise |
| 3 Too simple | 5 | 92% | 10 | 75% | a staircase border needs all five cuts: fewer is underfitting |
| 4 Few points | 3 | 92% | 4 | 70% | with little data a region around one point is large, and wrong |
| 5 Heavy noise | 2 | 81% | 12 | 61% | one point in five flipped: nobody beats the rule on average |
| 6 Three classes | 4 | 91% | 11 | 83% | three classes: the vote and Gini work the same |
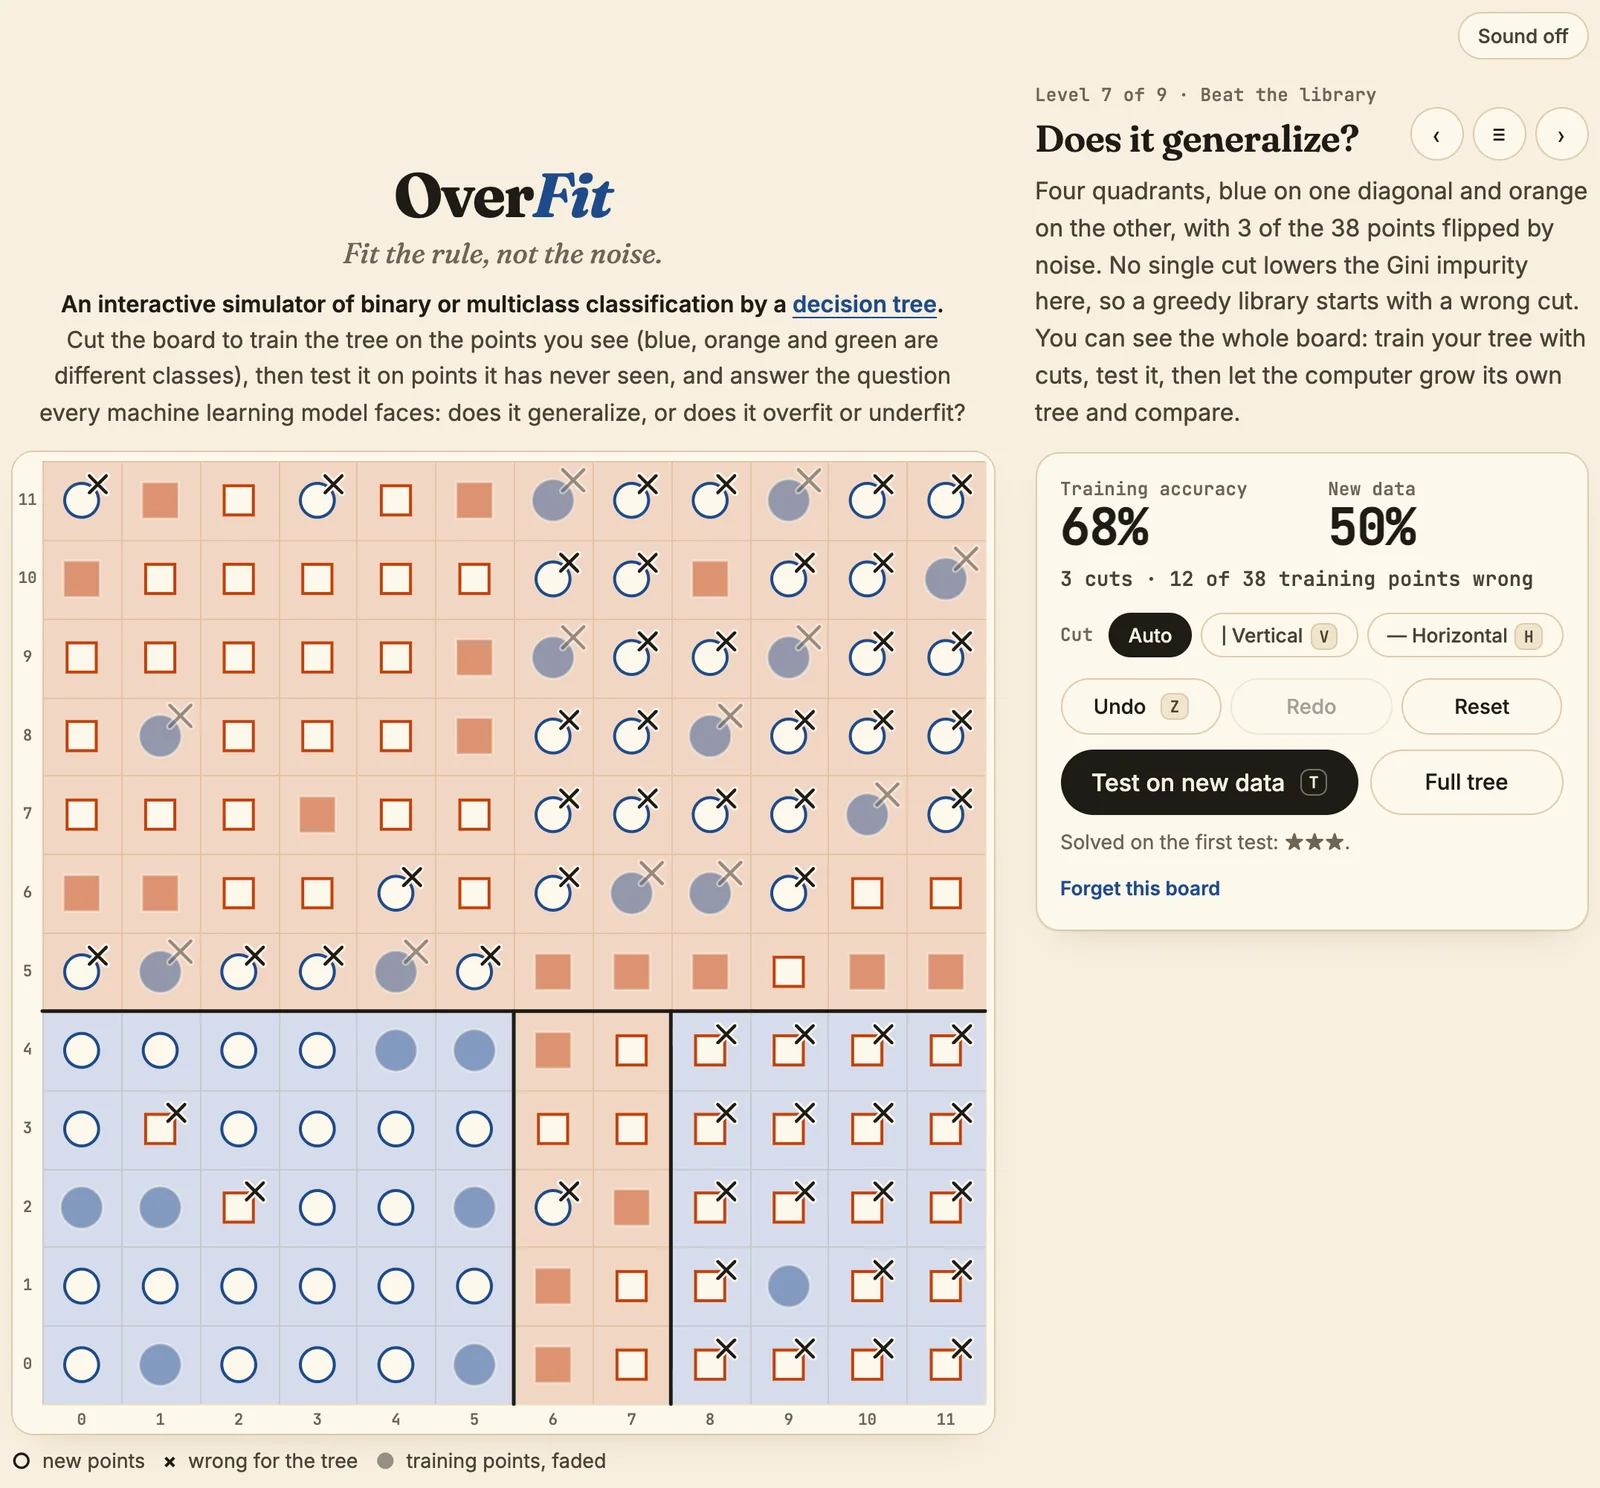
| 7 Beat the library | 3 | 92% | 13 | 70% | XOR: greedy growth starts with a wrong cut, 50% with three |
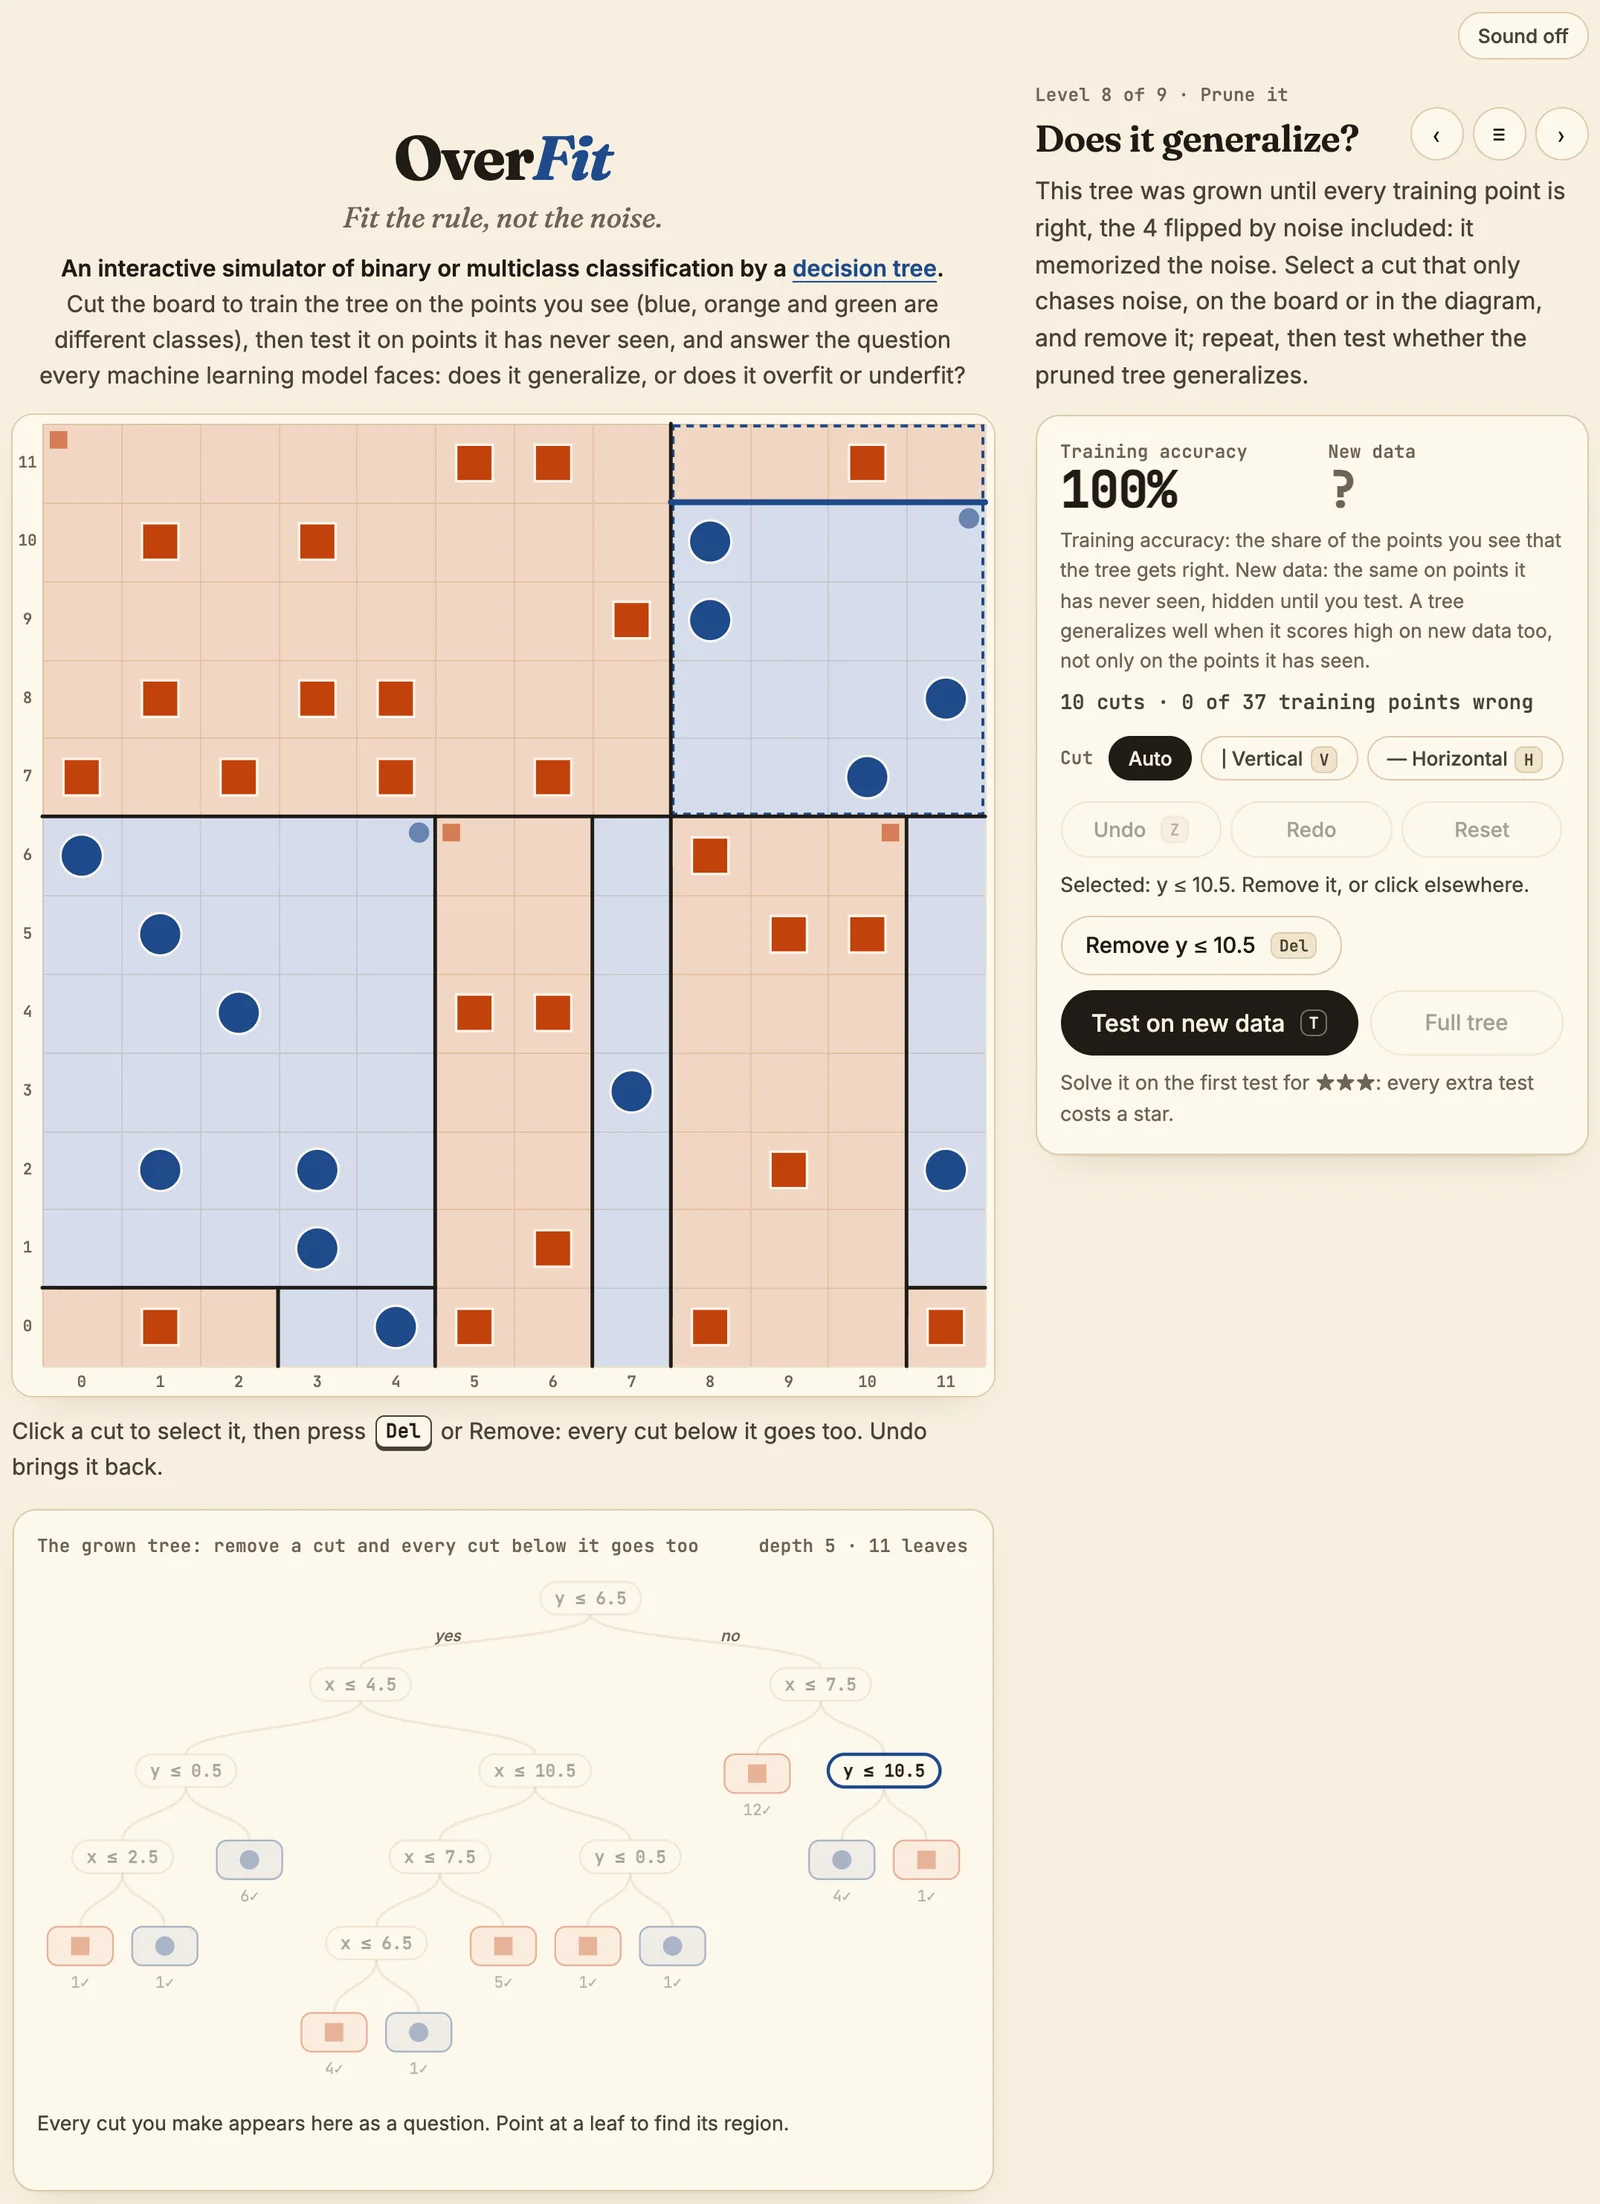
| 8 Prune it | 3 | 89% | 10 | 76% | opens on the full tree: remove the cuts that chase noise |
| 9 Two kinds of noise | 5 | 90% | 10 | 73% | with three colors two stray points can look like two things |
Every number is computed by the simulator's own modules; the level texts quote them through placeholders, so a board that changes changes its text.
Beat the library is the one board where the greedy growth is meant to start wrong. Four quadrants, blue on one diagonal and orange on the other, is the XOR pattern: a cut down or across the middle leaves both sides half blue and half orange, so no first cut lowers the Gini impurity, and the library takes the small drop the noise offers, in the wrong place, y ≤ 4.5. With three cuts it scores 50% on new data, the best it ever reaches is 75%, and the full tree ends at 70%; your three cuts generalize at 92%. A greedy algorithm looks one cut ahead, and this pattern only shows after two.
Prune it opens on the full tree, every training point right, the flipped ones included. You select the cuts that only chase noise, on the board or in the diagram, remove them and test. Cost-complexity pruning (CART; ccp_alpha in scikit-learn) does the same: grow the tree in full, then remove first the cuts that lower the impurity of the training points the least for each leaf they add. A test of the suite runs that weakest-link pruning on the board and checks that the sequence of trees passes through the three-cut pattern.
Every look at the test set costs a star.
- Solved. A level is solved when the tree is wrong on exactly the training points flipped by noise, as the rule is, and scores at least as much as the rule on new data. The simulator can judge this because it knows the rule the points came from, and the page says so: a real project only has the score.
- Ten verdicts. It generalizes · It generalizes, with some luck · Better than the rule, by luck · Right score, wrong tree · Overfitting: it generalizes worse · Underfitting: too simple to generalize well · Pruned too far · Cuts in the wrong place · Close, but it generalizes worse · Your tree changed: does it still generalize? Each comes with a lesson of a few lines that quotes the numbers of the board.
- Stars. Three for a level solved on the first test, two on the second, one after that. A tree already tested is free to test again; showing the rule, or letting the computer grow the tree, caps the level at one star; starting over keeps the count, because you have seen the new data. The reason is written under the curve: once the new data has been seen, every change made to score better on it uses it to choose the tree, and its score stops being a fair measure of generalization. Real projects tune on a validation set or by cross-validation and open the test set once, at the end.
- Stored honestly. Stars, tests and the trees tested, as the set of their predictions, so an equivalent tree is not charged twice, are kept in the browser under a key made of the level's name and a fingerprint of its board: a board that changes starts again from no stars.
Boards that teach, by construction.
A board teaches only if its numbers agree with its text, so each one is accepted only if it passes three checks, which run in the test suite on every level and on twenty random boards. The rule explains the points: every training point has the class of its cell under the rule, except the flipped ones, which sit away from the edges. The curve has the right shape: training accuracy never falls, accuracy on new data peaks at the rule's cuts and never rises again, and the full tree loses at least eight points. The board is fair: among all trees with at most as many cuts as the rule that are wrong on exactly the flipped points, the worst score on new data is at least the rule's, so a player who finds the rule's mistakes with the rule's number of cuts is never told the tree generalizes worse.
export function fittingProblems(x) { const worst = extremeTest(x, x.ruleCuts, { fit: true }); return worst < x.ruleTest - 1e-9 ? [`a tree with at most ${x.ruleCuts} cuts fits the training points like the rule but scores ${worst.toFixed(3)} on new data, the rule ${x.ruleTest.toFixed(3)}`] : [];}extremeTest is an exact search over every tree of a given size, memoized on region, fallback class and budget of cuts; a test compares it with trying every tree one by one.The rule of each level was written by hand for what the level should show. Its points were then drawn in thousands of candidate boards, generated in a headless browser with the simulator's own modules, each candidate placing points region by region with a share of them close to the rule's edges, and only candidates that passed the three checks were kept. The share near the edges matters: a staircase border, or a sparse board, is never reproduced by the greedy growth unless some points sit against its steps. A two-column step was never reproduced at all, which is why the middle step of level 3 is three columns wide.
Mouse, touch, keyboard, and seven boards to try.
The board is a canvas redrawn at the device's pixel density; the tree diagram and the curve are SVG, so their text stays sharp. With a mouse, moving over a grid line previews the cut and how training accuracy would change; on a phone a drag along the grid cuts, and a tap on a point shows its path through the tree; with the keyboard the arrows move a cursor, Enter cuts, T tests, Z undoes and Delete removes the selected cut. Classes have shapes as well as colors, the page has the site's light and dark themes, nothing blinks or pulses, and readers who ask their system for less motion get none.
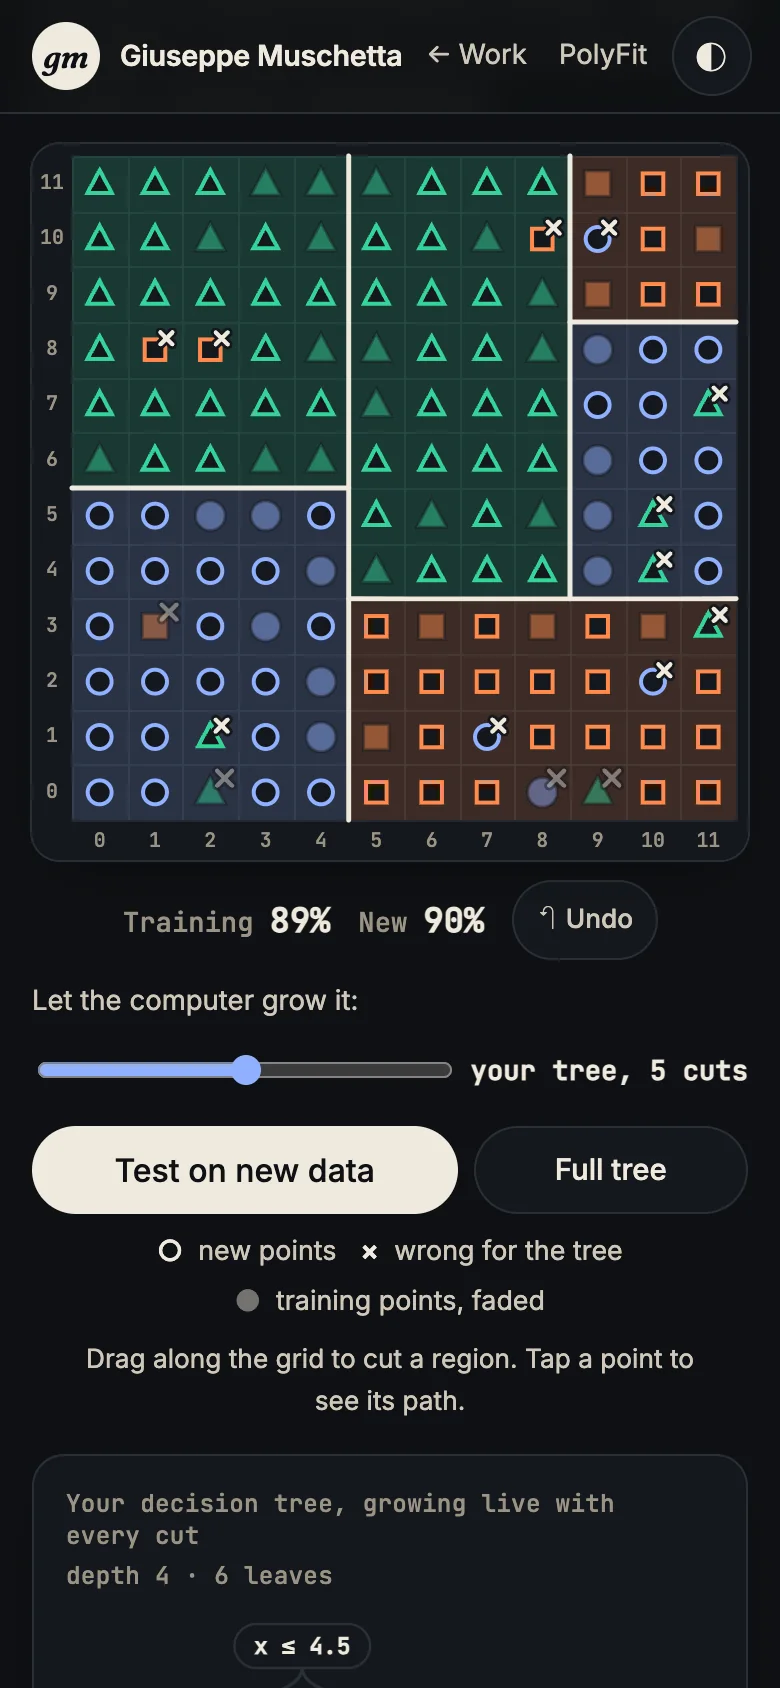
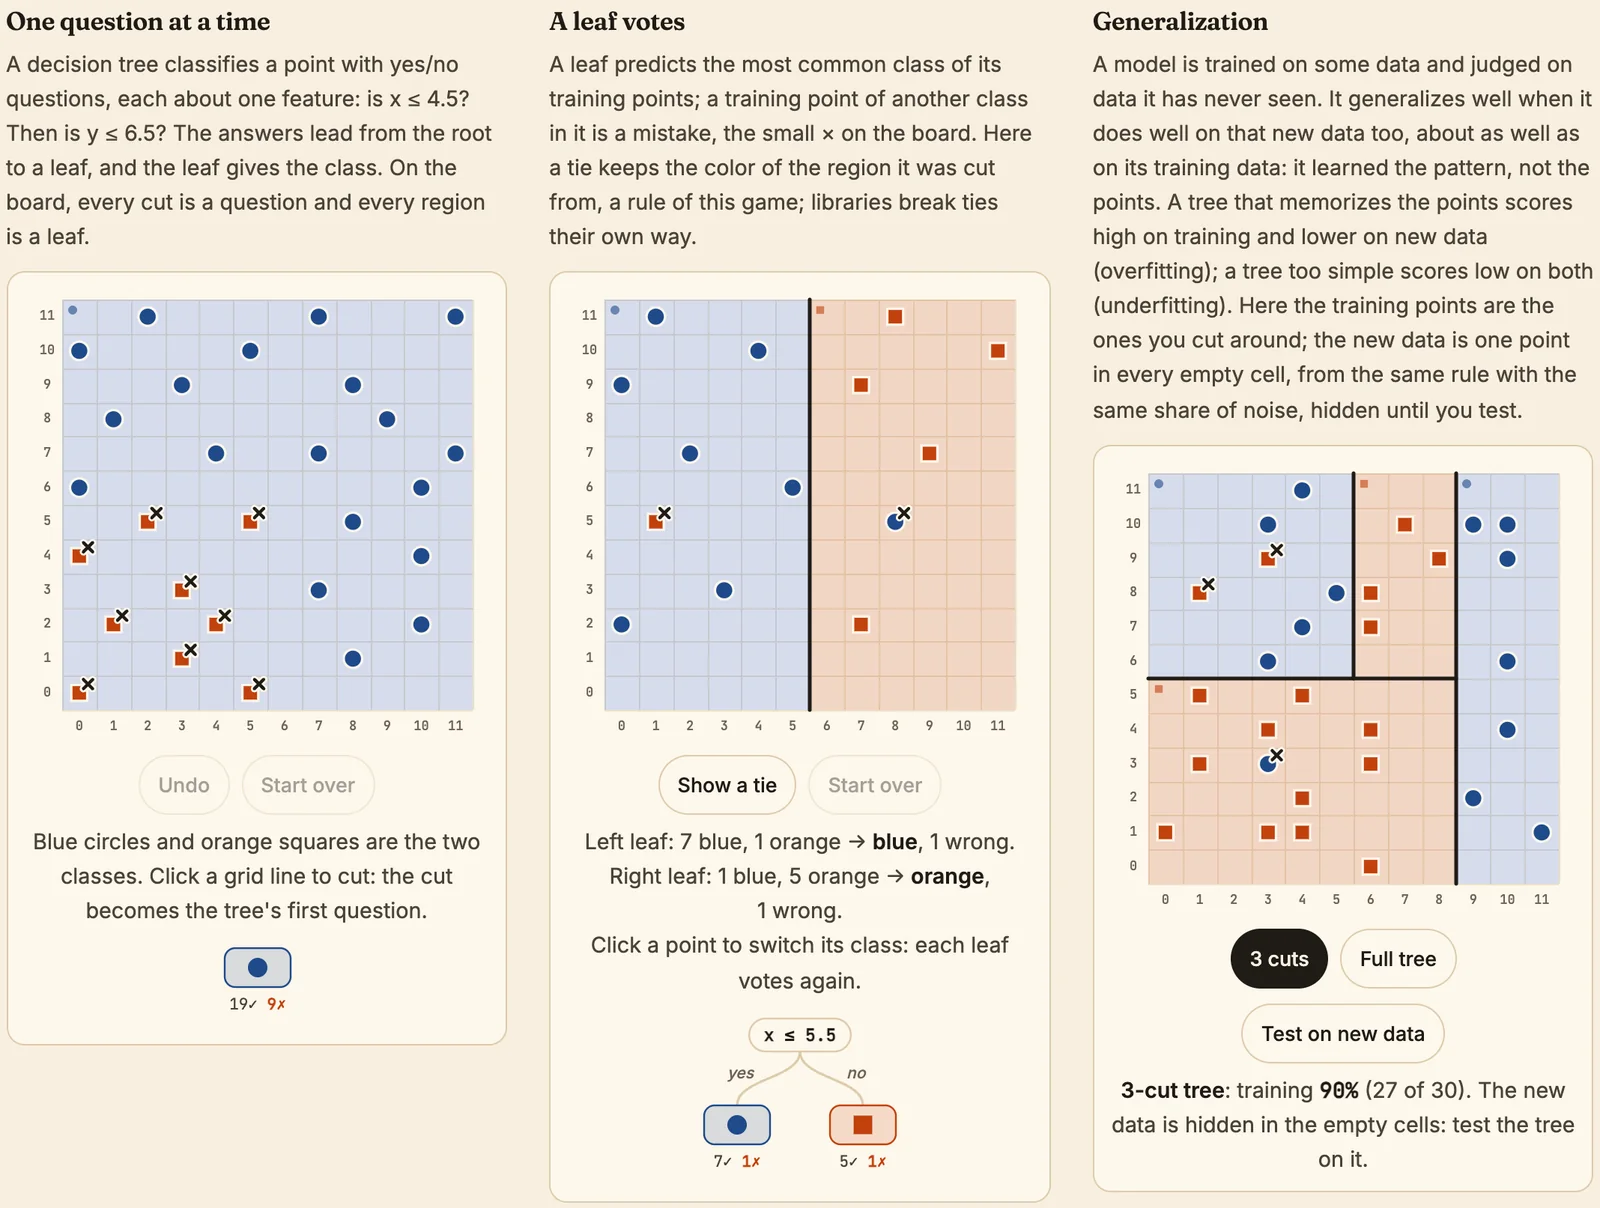
Under the levels, seven cards explain the model: one question at a time, a leaf votes, generalization, overfitting, underfitting, greedy growth, and stopping in time with a max_depth slider on a tree grown depth first, as CART grows it. Four of them share one board, 30 points with 3 flipped from a three-cut rule that scores 90% on training and 90% on new data; none equals a level, so the cards reveal no solution.
37 tests, and every board held to its claims.
The tests run in the browser, on the very modules of the simulator, with a harness of 49 lines written for the project. The engine tests cover the vote and its tie rule, Gini, cuts, undo and redo, snapshots and the thresholds in the middle of a gap. The level tests run the three checks on every board and then state, one test per level, what the level claims: the pair trap of level 1, the corner group of level 2, the three-column step of level 3, the wrong first cut of level 7, the pruning sequence of level 8. The suite runs in a third of a second.
| Test file | Tests | What they check |
|---|---|---|
| engine | 14 | boards, counts, the vote, Gini, cuts, history, snapshots, previews, paths, gaps |
| levels | 18 | the three checks on every board, the exact search against brute force, one claim per level |
| random boards | 5 | seeds, twenty random boards that pass the checks, three classes, the cards' board, speed |
The page on the site is 28 files and 230 KB, fonts excluded. Preparing a level, that is, drawing its new data and growing the whole curve, takes between 0.1 and 0.4 ms in Chrome on an Apple M5 Max, thanks to one table of two-dimensional prefix sums per class, which counts the points of any rectangle in constant time. The trees of the simulator are binary, one question per cut on one feature, as in CART and scikit-learn; my thesis built a different kind, with native categorical attributes and multiway splits.

One question. Does it generalize?
Nine boards, seven cards and a 21‑page report, and the test set is still shown once.